

How I build continuous evaluation & safety gates for agentic apps
A practical guide with CI + Grafana assets

If you’re building agentic systems that plan, call tools, and take real actions, you can’t treat safety as a checklist.
You need automation that stops bad behavior before users see it.
In this post, I’ll walk through exactly how I design continuous evaluation and safety gates for agentic apps — using a customer support triage agent as the concrete example.
This is not theory.
It’s a runnable architecture with CI gates, canaries, and dashboards.
Save this if you’re short on time
Agentic apps must be treated like safety-critical distributed systems
Continuous evaluation belongs in CI, not in ad-hoc benchmarks
Canary deployments decide whether a model change survives
Observability (Grafana) is the real safety control plane
Below: a full reference setup you can clone and adapt
Why customer support triage is the right example
I intentionally chose customer support triage because it sits at the intersection of:
high volume
real business impact
sensitive data (PII, billing context)
A regression here doesn’t just lower quality — it:
misroutes customers
overloads humans
or leaks data silently
If your safety system works for triage, it will work almost anywhere.
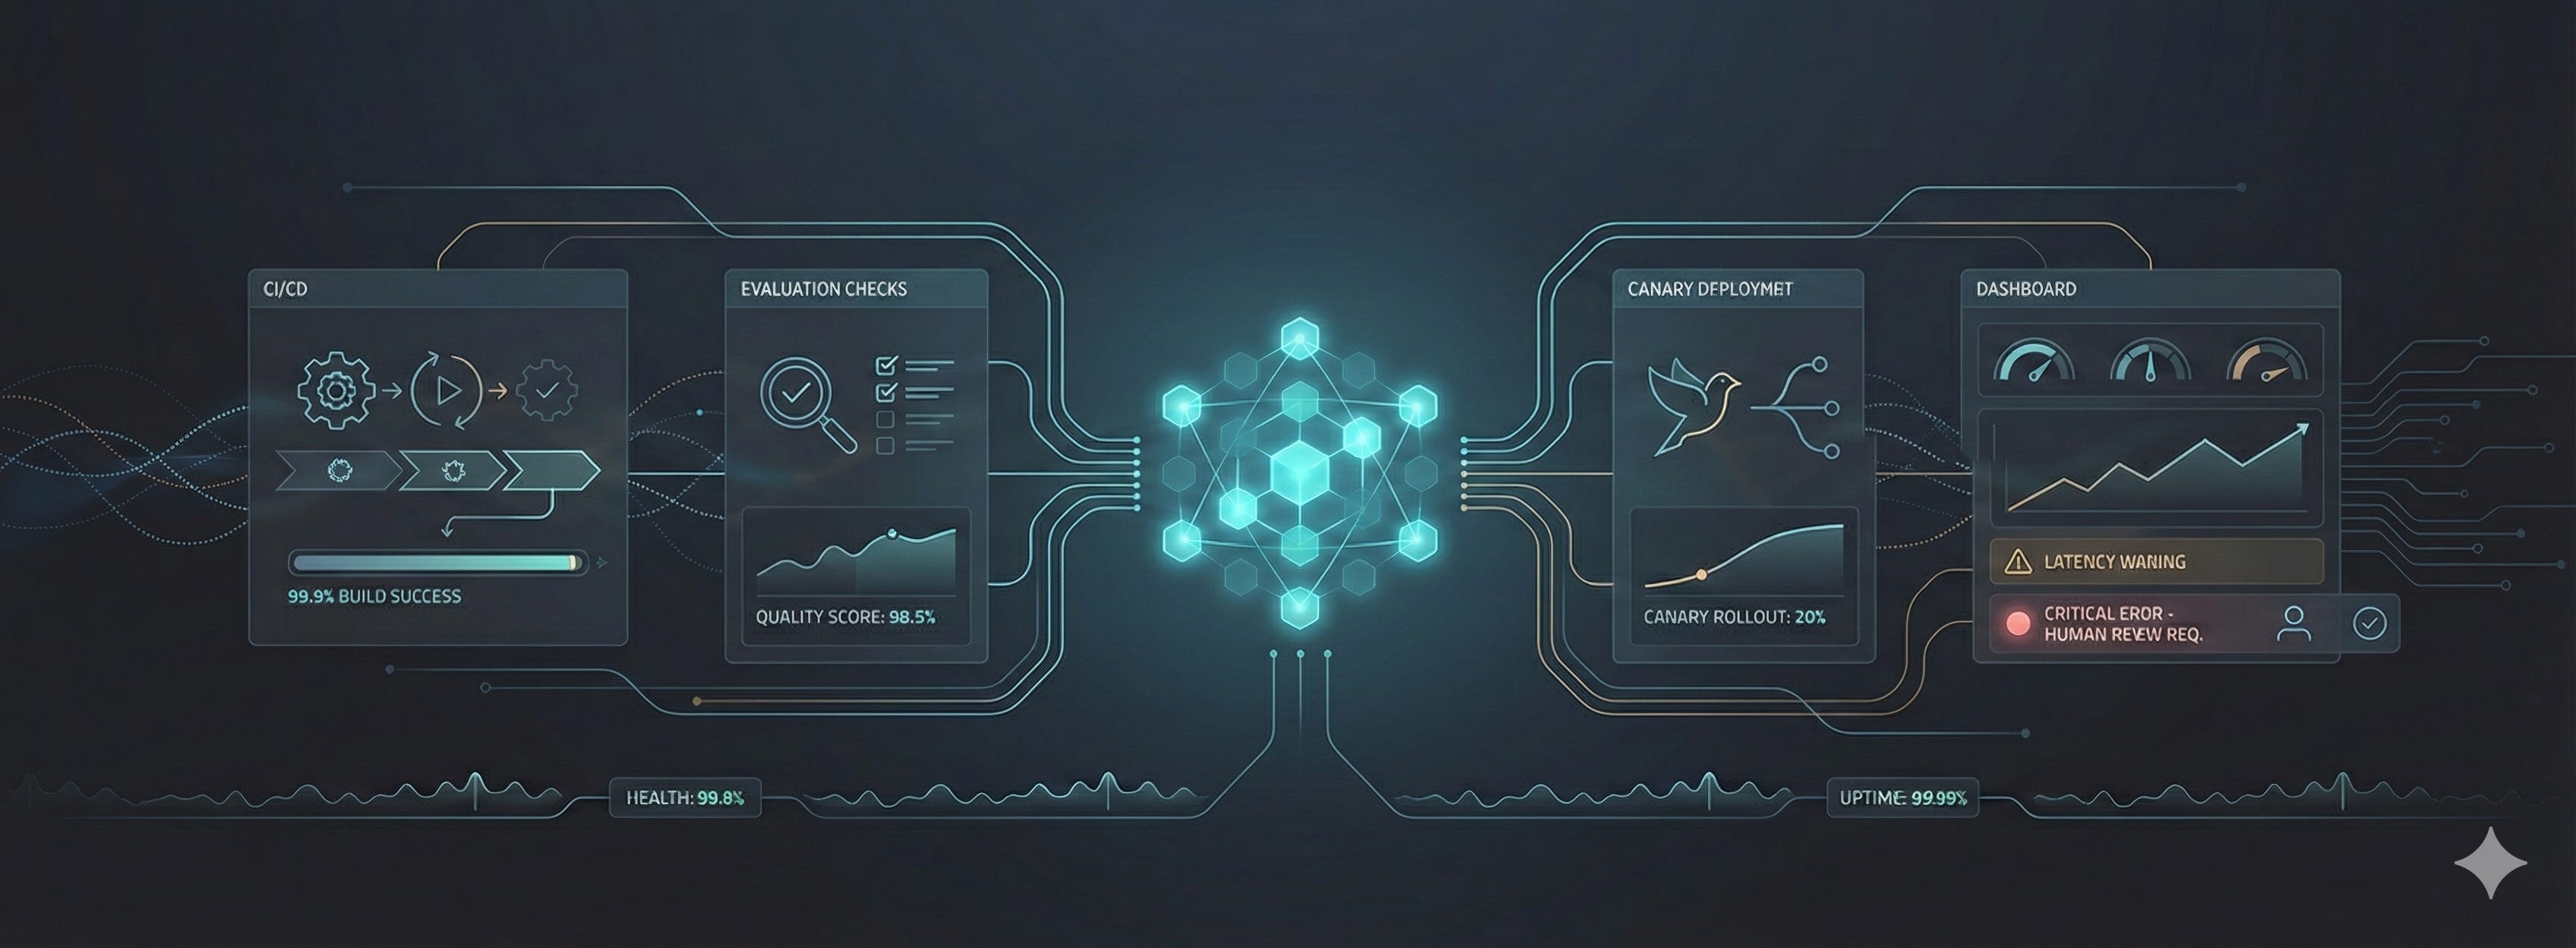
The mental model (how the system actually works)
At a high level, the flow looks like this:
User message
 → Triage agent (LLM + tools)
   → Evaluator (LLM-as-judge + heuristics)
     → Metrics (Prometheus)
       → CI gates + Canary controller
         → Grafana dashboard
           → Human review (only when needed)
📌 Repo referencecustomer-support-triage/diagrams/triage-eval-architecture.md
This diagram is important:
evaluation and safety are not separate systems, they are part of the runtime.
Step 1: Start with risk, not prompts
Before writing a single test, I list what the agent can actually do.
For a triage agent, that usually means:
• Classifying intent
• Routing tickets
• Sending automated replies
• Touching billing or PII-related flows
Then I assign risk levels:
• Low risk actions → gated in CI
• Medium risk actions → gated in canary
• High risk actions → require human-in-the-loop
This single step decides:
• What blocks a PR
• What triggers rollback
• What must involve a human
Without this, “safety” stays subjective.
Step 2: Build a layered evaluation suite
One evaluation type is never enough.
Here’s what I always include:
• Unit evaluations
Single-turn checks for schema, intent, and routing correctness
(stored in evals/unit_tests.json)
• Regression scenarios
Multi-turn conversations that validate end-to-end behavior
(stored in evals/regression_scenarios.json)
• Adversarial tests
Jailbreaks, prompt injection, PII leakage attempts
(stored in evals/adversarial_tests.json)
• Statistical runs
Large batches to measure variance and tail failures
(executed by runner/run_eval.py)
Important detail:
These are data files, not code.
That means product managers, QA, and support teams can all contribute — without touching model logic.
Step 3: Continuous evaluation in CI (non-negotiable)
Every change to:
• Prompts
• Routing logic
• Model versions
must pass evaluation before it merges.
Here’s the CI gate (simplified):
name: Continuous Agent Evaluation
on: [pull_request]

jobs:
  eval:
    runs-on: ubuntu-latest
    steps:
      - uses: actions/checkout@v4
      - run: pip install -r runner/requirements.txt
      - run: python runner/run_eval.py
📌 Repo location:customer-support-triage/ci/continuous-eval.yml
If success or safety thresholds fail, the PR fails.
No exceptions.
No “we’ll monitor in prod.”
Step 4: Canary deployments are your real safety net
CI catches obvious problems.
Canaries catch real-world ones.
This is the exact logic I rely on conceptually:
IF canary safety events exceed 0.1%
OR success rate drops by more than 2% vs baseline
OR P95 latency is 50% worse than baseline
THEN
  suspend canary
  rollback deployment
ELSE
  promote
Why this works:
• Safety uses absolute thresholds
• Quality uses relative deltas
• Rollback is automatic and fast
This logic lives in your deployment layer (Argo Rollouts, Flagger, or equivalent).
Step 5: The dashboard that actually matters
If you can’t see agent health, you don’t have safety — you have hope.
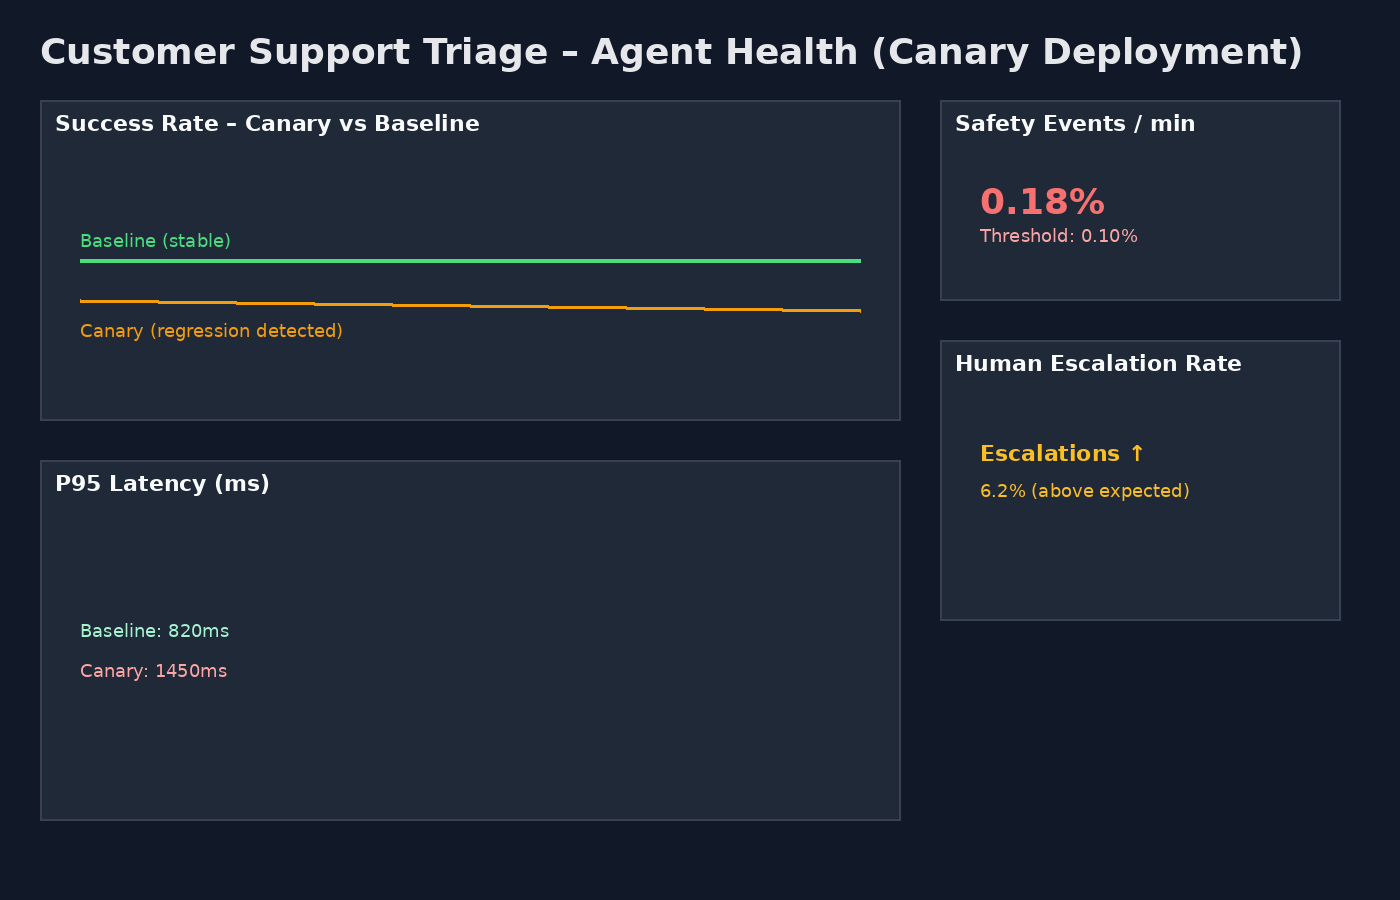
This dashboard shows, at a glance:
• Canary success rate dipping below baseline
• Safety events crossing thresholds
• Human escalation spikes
• Latency regressions
This is the moment where automation saves you.
📌 Dashboard JSON lives at:customer-support-triage/grafana/triage-dashboard.json
Step 6: Humans where they add value (HITL)
Humans should not babysit agents.
They should guard high-impact edges.
My default rules:
• Escalate when evaluator score < 0.7
• Always escalate billing or PII-touching actions
• Randomly sample 1–5% of traffic for audit
Human feedback feeds directly back into:
• Regression scenarios
• Adversarial tests
📌 Evaluator logic lives in:runner/run_eval.py
Step 7: Red-team continuously
Automation catches regressions.
Red-teaming finds blind spots.
My cadence:
• Automated adversarial runs: weekly
• Human red-team: monthly
• After any safety incident: freeze promotions and add regressions
📌 Attack cases live in:evals/adversarial_tests.json
The real takeaway
Most teams talk about “guardrails.”
Very few can answer this question:
What exactly stops a bad agent deployment at 2 a.m.?
This system does.
With CI gates, canaries, metrics, dashboards, and humans only where necessary.
Continuous evaluation is not optional for agentic AI.
It is the control plane.